

Consumer Insights
Uncover trends and behaviors shaping consumer choices today
Procurement Insights
Optimize your sourcing strategy with key market data
Industry Stats
Stay ahead with the latest trends and market analysis.

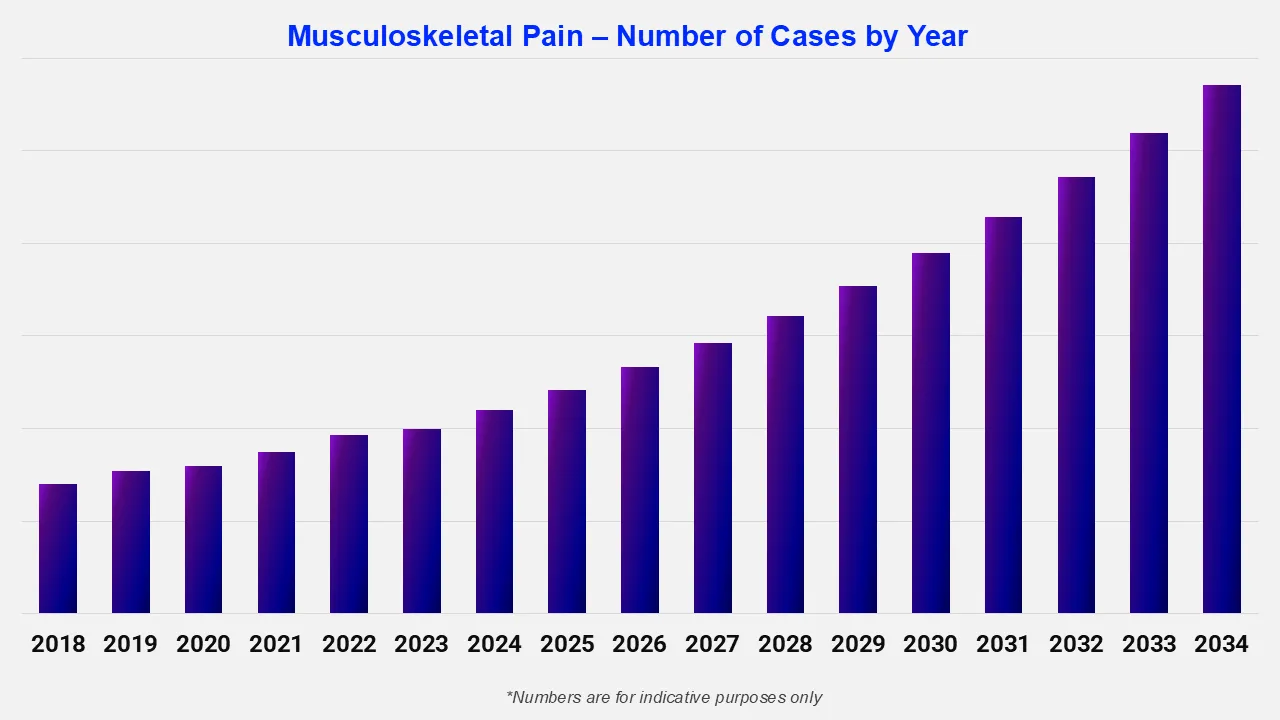
The musculoskeletal pain epidemiology forecast indicates that joint and muscle pain is a major global health issue, affecting mobility and quality of life. Around 1.71 billion people have musculoskeletal conditions, with lower back pain being the leading cause of disability in 160 countries. In 2019, 39.0% of adults experienced back pain, 36.5% lower limb pain, and 30.7% upper limb pain.
Base Year
Historical Period
Forecast Period
Read more about this report - Request a Free Sample
Expert Market Research's “Musculoskeletal Pain Epidemiology Forecast Report 2026-20352025-2034” offers comprehensive information on the prevalence and demographics of musculoskeletal pain. It projects the future incidence and prevalence rates of musculoskeletal pain cases across various populations. The study covers age and type as major determinants of the musculoskeletal pain population. The report highlights patterns in the prevalence of musculoskeletal pain over time and projects future trends based on multiple variables.
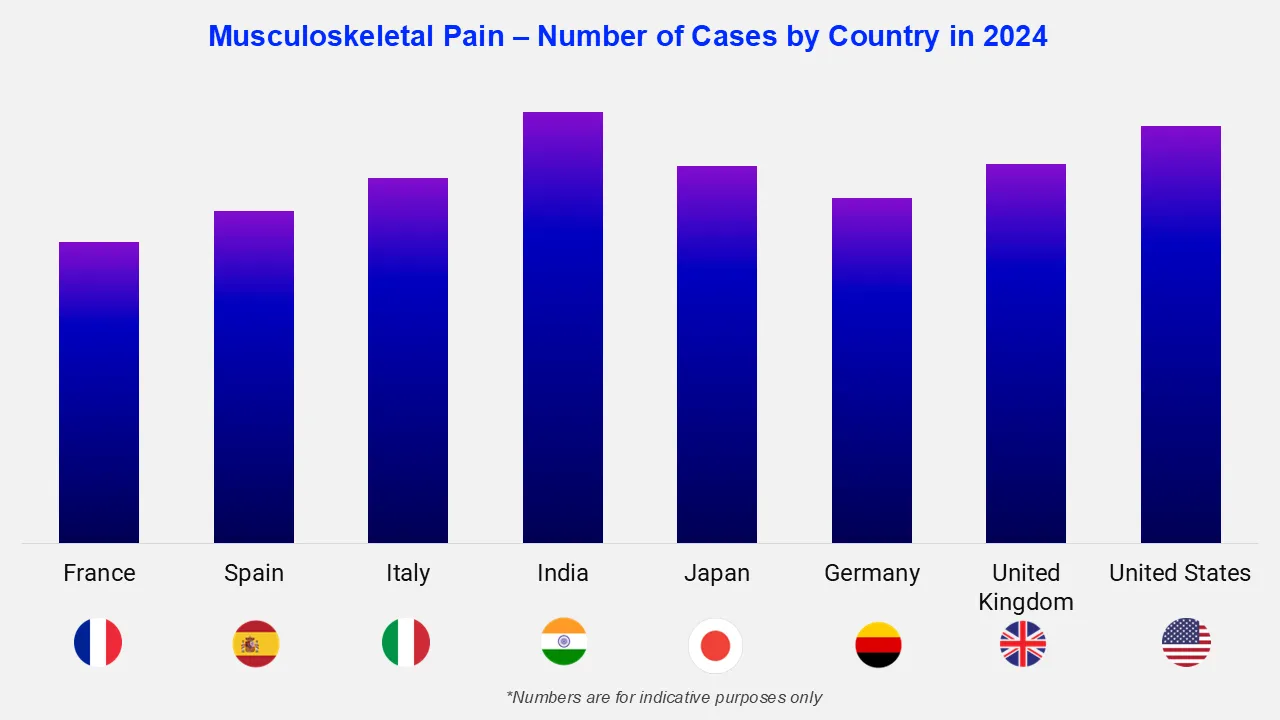
The report provides a comprehensive overview of the disease, as well as historical and projected data on musculoskeletal pain epidemiology in the 8 major markets.
Regions Covered
Musculoskeletal pain affects the bones, muscles, ligaments, tendons, and nerves, causing discomfort, stiffness, and reduced mobility. It can be acute or chronic, impacting daily activities and quality of life. Common causes include back pain, joint pain, and muscle strains, with conditions like osteoarthritis and fibromyalgia also contributing. Treatment approaches vary, ranging from physical therapy and medication to lifestyle changes and, in some cases, surgical intervention, aiming to alleviate symptoms and improve function.
The musculoskeletal pain epidemiology division offers information on the patient pool from history to the present as well as the projected trend for each of the 8 major markets. Expert Market Research provides both current and predicted trends for musculoskeletal pain epidemiology scenario by examining a wide range of studies. Additionally, the report covers the diagnosed patient pool for the disease and their trends. the musculoskeletal pain detailed epidemiology segmentation is broken down into specific categories, such as the total diagnosed cases across different age groups and patient pools.
Read more about this report - Request a Free Sample
The musculoskeletal pain epidemiology data and findings for the United States, Germany, Spain, Italy, France, the United Kingdom, Japan, and India are also provided in the epidemiology section.
Musculoskeletal pain is a major global health concern, significantly impacting quality of life and contributing to disability. According to the World Health Organization, approximately 1.71 billion people worldwide suffer from musculoskeletal conditions, making them the leading cause of disability. Low back pain alone is the top cause of disability in 160 countries. High-income nations are most affected, with 441 million cases, followed by the WHO Western Pacific Region (427 million) and South-East Asia (369 million). Musculoskeletal conditions, including musculoskeletal pain, account for 149 million years lived with disability (YLDs), representing 17% of the global total. In the UK, nearly one-third of the population, over 20 million people, experience musculoskeletal conditions, with rising healthcare demands as the ageing population grows.
Musculoskeletal pain treatment focuses on relieving symptoms, improving function, and preventing further issues. Management includes musculoskeletal pain therapeutics like pain relievers, anti-inflammatory drugs, and muscle relaxants. Physical therapy helps strengthen muscles and improve mobility, while lifestyle changes such as exercise, weight management, and posture correction can reduce strain. In severe cases, corticosteroid injections or surgical interventions may be necessary. Alternative therapies like acupuncture and chiropractic care may provide additional relief. A multidisciplinary approach, combining medical, rehabilitative, and self-care strategies, is essential for effective long-term management of musculoskeletal pain.


Upto 15% Off
USD
$1999 $1799
$2999 $2699
$4399 $3739
$5799 $4929


*While we strive to always give you current and accurate information, the numbers depicted on the website are indicative and may differ from the actual numbers in the main report. At Expert Market Research, we aim to bring you the latest insights and trends in the market. Using our analyses and forecasts, stakeholders can understand the market dynamics, navigate challenges, and capitalize on opportunities to make data-driven strategic decisions.*
Get in touch with us for a customized solution tailored to your unique requirements and save upto 35%!
Explore our key highlights of the report and gain a concise overview of key findings, trends, and actionable insights that will empower your strategic decisions.
|
Report Features |
Details |
|
Base Year |
2025 |
|
Historical Period |
2019-2025 |
|
Forecast Period |
2026-2035 |
|
Geographies Covered |
|
Datasheet
One User
USD 1,999
USD 1,799
tax inclusive*
Single User License
One User
USD 2,999
USD 2,699
tax inclusive*
Five User License
Five User
USD 4,399
USD 3,739
tax inclusive*
Corporate License
Unlimited Users
USD 5,799
USD 4,929
tax inclusive*
*Please note that the prices mentioned below are starting prices for each bundle type. Kindly contact our team for further details.*
Flash Bundle
Small Business Bundle
Growth Bundle
Enterprise Bundle
*Please note that the prices mentioned below are starting prices for each bundle type. Kindly contact our team for further details.*
Flash Bundle
Number of Reports: 3
20%
tax inclusive*
Small Business Bundle
Number of Reports: 5
25%
tax inclusive*
Growth Bundle
Number of Reports: 8
30%
tax inclusive*
Enterprise Bundle
Number of Reports: 10
35%
tax inclusive*
How To Order

Select License Type
Choose the right license for your needs and access rights.

Click on ‘Buy Now’
Add the report to your cart with one click and proceed to register.

Select Mode of Payment
Choose a payment option for a secure checkout. You will be redirected accordingly.
Gain insights to stay ahead and seize opportunities.

Get insights & trends for a competitive edge.

Track prices with detailed trend reports.

Analyse trade data for supply chain insights.

Leverage cost reports for smart savings

Enhance supply chain with partnerships.

Connect For More Information
Our expert team of analysts will offer full support and resolve any queries regarding the report, before and after the purchase.
Our expert team of analysts will offer full support and resolve any queries regarding the report, before and after the purchase.
We employ meticulous research methods, blending advanced analytics and expert insights to deliver accurate, actionable industry intelligence, staying ahead of competitors.
Our skilled analysts offer unparalleled competitive advantage with detailed insights on current and emerging markets, ensuring your strategic edge.
We offer an in-depth yet simplified presentation of industry insights and analysis to meet your specific requirements effectively.


Share