Explore Our Diverse Range Of Offerings
From detailed reports to experts services offered in 15+ Industry Domains
Report
Press Release
Blogs
Industry Statistics
Add 2 More Reports For 20% off

Menopause Associated Vasomotor Symptoms Epidemiology Forecast

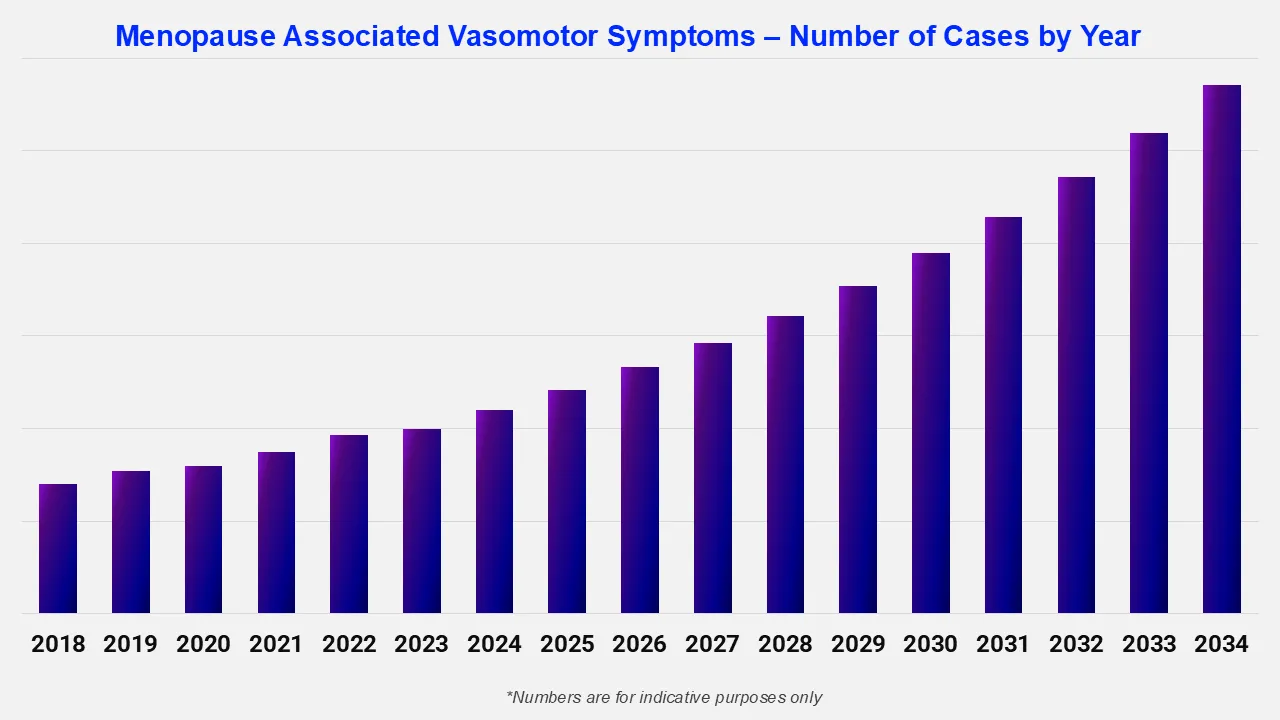
The menopause associated vasomotor symptoms epidemiology forecast suggests that hot flashes and night sweats affect a significant portion of women worldwide, especially as the global population of aging women increases. Hot flashes are one of the most common menopausal vasomotor symptoms, impacting about 74% of perimenopausal women. Research shows that 65% of women have hot flashes for over 2 years, and 36% experience them for more than 5 years. Additionally, it is reported that about 3 in 4 women, or 75% of women, experience hot flashes during the years leading up to menopause (known as perimenopause), according to the Cleveland Clinic.

2025

Base Year

2019-2025

Historical Period

2026-2035

Forecast Period

Menopause Associated Vasomotor Symptoms Number Of Cases By Year

Read more about this report - Request a Free Sample

Menopause Associated Vasomotor Symptoms Epidemiology Forecast Report Coverage

Expert Market Research's “Menopause Associated Vasomotor Symptoms Epidemiology Forecast Report 2026-2035” offers comprehensive information on the prevalence and demographics of menopause associated vasomotor symptoms. It projects the future incidence and prevalence rates of menopause associated vasomotor symptoms cases across various populations. The study covers age and type as major determinants of the menopause associated vasomotor symptoms population. The report highlights patterns in the prevalence of menopause associated vasomotor symptoms over time and projects future trends based on multiple variables.

The report provides a comprehensive overview of the disease, as well as historical and projected data on menopause associated vasomotor symptoms epidemiology in the 8 major markets.

Regions Covered

  • The United States
  • Germany
  • France
  • Italy
  • Spain
  • The United Kingdom
  • Japan
  • India

Menopause Associated Vasomotor Symptoms Understanding: Disease Overview

Menopause-associated vasomotor symptoms (VMS), primarily hot flashes and night sweats, are common symptoms that many women experience during the menopausal transition. These symptoms are caused by changes in hormone levels. Studies show that the drop in estrogen, which affects the ability of the body to regulate temperature, can account for menopause-associated vasomotor symptoms.

Several factors can affect the severity and duration of menopause-associated vasomotor symptoms. Age is the most important factor, as symptoms typically start during perimenopause. Lifestyle factors, such as obesity, smoking, and lack of exercise, are reported to worsen these symptoms.

Menopause Associated Vasomotor Symptoms Epidemiology Perspective

The menopause associated vasomotor symptoms epidemiology division offers information on the patient pool from history to the present as well as the projected trend for each of the 8 major markets. Expert Market Research provides both current and predicted trends for menopause associated vasomotor symptoms epidemiology scenario by examining a wide range of studies. Additionally, the report covers the diagnosed patient pool for the disease and their trends. The menopause associated vasomotor symptoms detailed epidemiology segmentation is broken down into specific categories, such as the total diagnosed cases across different age groups and patient pools.

  • According to the global cross-sectional survey of women with vasomotor symptoms (2021), the prevalence of moderate-to-severe menopause associated vasomotor symptoms was 40% in Europe, 34% in the United States, and 16% in Japan. A significant number of women were hormone therapy-averse, with 56% in Europe, 54% in the United States, and 79% in Japan, while 12% (Europe), 9% (United States), and 8% (Japan) were hormone therapy-contraindicated.
  • As per a 2023 European cross-sectional survey, the prevalence of moderate-to-severe menopause associated vasomotor symptoms varied from 31% in France to 52% in Italy. Despite being eligible for hormone therapy, the majority of women were either in the hormone therapy-cautious or hormone therapy-averse group.
  • It is estimated that about 3 in 4 women, or 75% of women, experience hot flashes during the years leading up to menopause (known as perimenopause), as per the Cleveland Clinic.
  • The prevalence of menopause associated vasomotor symptoms in North America ranges from 41% to 77%, and are reported to severely impact quality of life, work productivity, daily activities, and sleep.

Menopause Associated Vasomotor Symptoms Number Of Cases By Country

Read more about this report - Request a Free Sample

Country-wise Menopause Associated Vasomotor Symptoms Epidemiology Segment

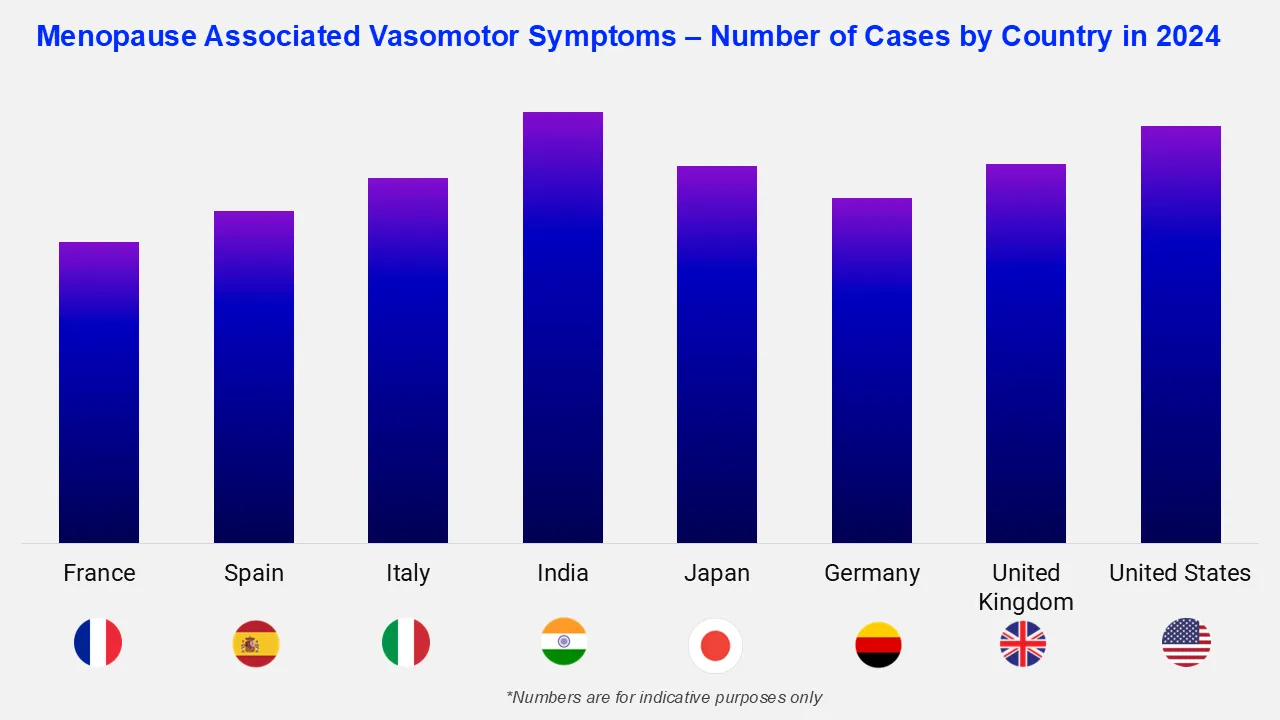
The menopause associated vasomotor symptoms epidemiology data and findings for the United States, Germany, Spain, Italy, France, the United Kingdom, Japan, and India are also provided in the epidemiology section.

The epidemiology of menopause associated vasomotor symptoms varies significantly between countries due to differences in dietary habits, lifestyle choices, ethnic backgrounds, and the availability and use of hormone replacement therapy (HRT) and other treatments. Various studies have shown that the prevalence of moderate to severe vasomotor symptoms postmenopause is reported as 32% to 46% in the United States, 31% to 52% in Europe, and 16% in Japan.

Menopause Associated Vasomotor Symptoms: Treatment Overview

Hormone replacement therapy (HRT) is one of the primary menopause-associated vasomotor symptoms therapeutics for managing hot flashes and night sweats. HRT, available in different forms, including pills, patches, and gels, replaces the estrogen that the body no longer produces during menopause. Hormone replacement therapy is often combined with progestin for women who still have their uterus.

Several non-hormonal medications like selective serotonin-norepinephrine reuptake inhibitors (SSRIs), serotonin-norepinephrine reuptake inhibitors (SNRIs), gabapentin, and clonidine are also available for women who cannot or prefer not to take hormones.

Key Questions Answered

  • What are the key findings of menopause associated vasomotor symptoms epidemiology in the 8 major markets?
  • What will be the total number of patients with menopause associated vasomotor symptoms across the 8 major markets during the forecast period?
  • What was the country-wise menopause associated vasomotor symptoms epidemiology scenario in the 8 major markets in the historical period?
  • Which country will have the highest number of menopause associated vasomotor symptoms patients during the forecast period of 2026-2035?
  • Which key factors would influence the shift in the patient population of menopause associated vasomotor symptoms during the forecast period of 2026-2035?
  • What are the currently available treatments in the menopause associated vasomotor symptoms market?
  • What are the disease risks, signs, symptoms, and unmet needs of menopause associated vasomotor symptoms?

Scope of the Menopause Associated Vasomotor Symptoms Epidemiology Report

  • The report covers a detailed analysis of signs and symptoms, causes, risk factors, pathophysiology, diagnosis, treatment options, and classification/types of menopause associated vasomotor symptoms based on several factors.
  • The Menopause Associated Vasomotor Symptoms Epidemiology Forecast Report covers data for the eight major markets (the US, France, Germany, Italy, Spain, the UK, Japan, and India).
  • The menopause associated vasomotor symptoms report helps to identify the patient population, and the unmet needs are highlighted along with an assessment of the disease's risk and burden.

Related Reports

Global Vasomotor Symptoms Treatment Market Report and Forecast

Vasomotor Symptoms of Menopause Drug Pipeline Analysis Report

*While we strive to always give you current and accurate information, the numbers depicted on the website are indicative and may differ from the actual numbers in the main report. At Expert Market Research, we aim to bring you the latest insights and trends in the market. Using our analyses and forecasts, stakeholders can understand the market dynamics, navigate challenges, and capitalize on opportunities to make data-driven strategic decisions.*

Looking for specific insights?

Get in touch with us for a customized solution tailored to your unique requirements and save upto 35%!

Report Summary

Explore our key highlights of the report and gain a concise overview of key findings, trends, and actionable insights that will empower your strategic decisions.

Key Highlights of the Report

Please note that the figures mentioned in the description serve as estimates and may vary from the actual figures presented in the final report.

Report Features

Details

Base Year

2025

Historical Period

2019-2025

Forecast Period

2026-2035

Geographies Covered

  • United States
  • Germany
  • Italy
  • France
  • Spain
  • United Kingdom
  • Japan
  • India

Datasheet

10 % Off

USD

1,999

1,799

Single User License

10 % Off

USD

2,999

2,699

Five User License

15 % Off

USD

4,399

3,739

Corporate License

15 % Off

USD

5,799

4,929

Datasheet

One User

USD 1,999

USD 1,799

tax inclusive*

  • Selected Segments
  • Printing Restrictions
  • Excel Spreadsheet Delivered via Email
  • Full Report
  • Periodic Updates
  • Post Sales Analysts Support
  • Unlimited Prints

Single User License

One User

USD 2,999

USD 2,699

tax inclusive*

  • All Segments
  • Printing Restrictions
  • PDF Delivered via Email
  • Custom Report Layout
  • Post Sales Analysts Support
  • Periodic Updates
  • Unlimited Prints

Five User License

Five User

USD 4,399

USD 3,739

tax inclusive*

  • All Segments
  • Five Prints Available
  • PDF Delivered via Email
  • Limited Free Customization
  • Post Sales Analyst Support
  • Custom Report Layout
  • Periodic Updates
  • Unlimited Prints

Corporate License

Unlimited Users

USD 5,799

USD 4,929

tax inclusive*

  • All Segments
  • Unlimited Prints Available
  • PDF & Excel Delivery via Email
  • Limited Free Customization
  • Post Sales Analysts Support
  • Discount On Next Update
  • Custom Report Layout

*Please note that the prices mentioned below are starting prices for each bundle type. Kindly contact our team for further details.*

Bundle Type

Flash Bundle

20% OFF Number of Reports: 3

Small Business Bundle

25% OFF Number of Reports: 5

Growth Bundle

30% OFF Number of Reports: 8

Enterprise Bundle

35% OFF Number of Reports: 10
Overview
  • Life Time Access
  • Analyst Support Related to Report
  • PDF Version of the Report
  • Complimentary Excel Data Set
  • Free Analyst Hours
  • Complimentary Free 1 Month Subscription to Trade Data Base
  • Complimentary One Month Subscription to Price Database (Chemicals only)
  • Complimentary PPT Version of the Report
  • Complimentary License Upgrade
  • Complimentary Power BI Dashboards
  • Life Time Access
  • Analyst Support Related to Report
  • PDF Version of the Report
  • Complimentary Excel Data Set
  • Free Analyst Hours - 50 Hours
  • Complimentary Free 1 Month Subscription to Trade Data Base
  • Complimentary One Month Subscription to Price Database (Chemicals only)
  • Complimentary PPT Version of the Report
  • Complimentary License Upgrade
  • Complimentary Power BI Dashboards
  • Life Time Access
  • Analyst Support Related to Report
  • PDF Version of the Report
  • Complimentary Excel Data Set
  • Free Analyst Hours - 80 Hours
  • Complimentary Free 1 Month Subscription to Trade Data Base
  • Complimentary One Month Subscription to Price Database (Chemicals only)
  • Complimentary PPT Version of the Report
  • Complimentary License Upgrade
  • Complimentary Power BI Dashboards
  • Life Time Access
  • Analyst Support Related to Report
  • PDF Version of the Report
  • Complimentary Excel Data Set
  • Free Analyst Hours - 100 Hours
  • Complimentary Free 1 Month Subscription to Trade Data Base
  • Complimentary One Month Subscription to Price Database (Chemicals only)
  • Complimentary PPT Version of the Report
  • Complimentary License Upgrade
  • Complimentary Power BI Dashboards

*Please note that the prices mentioned below are starting prices for each bundle type. Kindly contact our team for further details.*

Flash Bundle

Number of Reports: 3

20%

tax inclusive*

  • 3 Reports Included
  • Life Time Acess
  • Analyst Support Related to Report
  • PDF Version of the Report
  • Free 1 Month Subscription to Trade Data Base
  • 1 Month Subscription to Price Database (Chemicals only)
  • Complimentary Excel Data Set
  • PPT Version of the Report
  • Power BI Dashboards
  • License Upgrade
  • Free Analyst Hours

Small Business Bundle

Number of Reports: 5

25%

tax inclusive*

  • 5 Reports Included
  • Life Time Acess
  • Analyst Support Related to Report
  • PDF Version of the Report
  • Complimentary Excel Data Set
  • Free Analyst Hours - 50 Hours
  • Free 1 Month Subscription to Trade Data Base
  • 1 Month Subscription to Price Database (Chemicals only)
  • Complimentary Excel Data Set
  • PPT Version of the Report
  • Power BI Dashboards
  • License Upgrade

Growth Bundle

Number of Reports: 8

30%

tax inclusive*

  • 8 Reports Included
  • Life Time Acess
  • Analyst Support Related to Report
  • PDF Version of the Report
  • Complimentary Excel Data Set
  • Free Analyst Hours - 50 Hours
  • Free 1 Month Subscription to Trade Data Base
  • 1 Month Subscription to Price Database (Chemicals only)
  • License Upgrade
  • Free Analyst Hours - 80 Hours
  • Power BI Dashboards

Enterprise Bundle

Number of Reports: 10

35%

tax inclusive*

  • 10 Reports Included
  • Life Time Acess
  • Analyst Support Related to Report
  • PDF Version of the Report
  • Complimentary Excel Data Set
  • Free Analyst Hours - 50 Hours
  • Free 1 Month Subscription to Trade Data Base
  • 1 Month Subscription to Price Database (Chemicals only)
  • License Upgrade
  • Power BI Dashboards
  • Free Analyst Hours - 100 Hours

How To Order

This is a collaborative report by Vishakha Agrawal reflecting perspectives and research-driven insights from Expert Market Research.

Our step-by-step guide will help you select, purchase, and access your reports swiftly, ensuring you get the information that drives your decisions, right when you need it.

License Type

Select License Type

Choose the right license for your needs and access rights.

shopping cart

Click on ‘Buy Now’

Add the report to your cart with one click and proceed to register.

Select Mode of Payment

Choose a payment option for a secure checkout. You will be redirected accordingly.

Strategic Solutions for Informed Decision-Making

Connect For More Information

Our expert team of analysts will offer full support and resolve any queries regarding the report, before and after the purchase.

Our expert team of analysts will offer full support and resolve any queries regarding the report, before and after the purchase.

We employ meticulous research methods, blending advanced analytics and expert insights to deliver accurate, actionable industry intelligence, staying ahead of competitors.

Our skilled analysts offer unparalleled competitive advantage with detailed insights on current and emerging markets, ensuring your strategic edge.

We offer an in-depth yet simplified presentation of industry insights and analysis to meet your specific requirements effectively.

We’re here to help answer any questions about our products and services.

Contact us