Explore Our Diverse Range Of Offerings
From detailed reports to experts services offered in 15+ Industry Domains
Report
Press Release
Blogs
Industry Statistics
Add 2 More Reports For 20% off

Gastroparesis Epidemiology Forecast

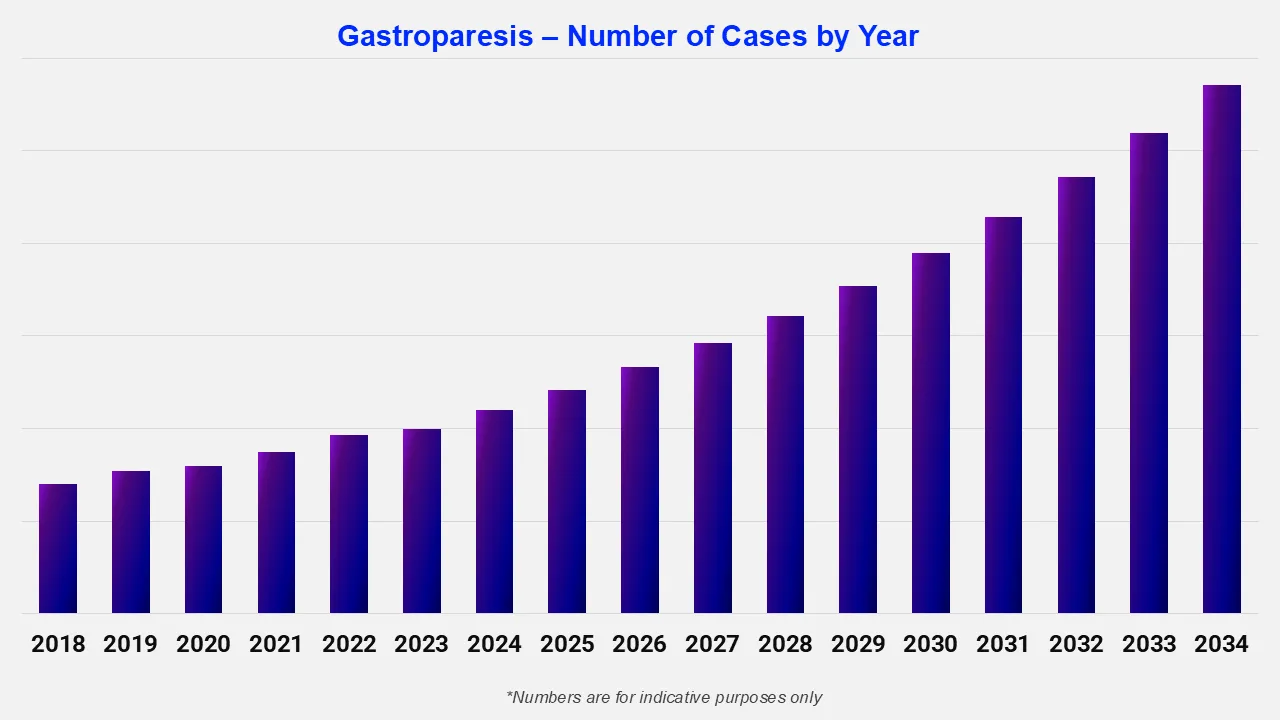
According to a 2023 systematic review, the overall standardized prevalence of gastroparesis varied significantly, ranging from 13.8 to 267.7 per 100,000 adults in studies conducted between 1994 and 2019. Further, two United States studies using community-based databases estimated a prevalence of 21.5 per 100,000 adults and 24.2 per 100,000 adults, respectively.

2025

Base Year

2019-2025

Historical Period

2026-2035

Forecast Period

Gastroparesis Number Of Cases By Year

Read more about this report - Request a Free Sample

Gastroparesis Epidemiology Forecast Report Coverage

Expert Market Research's “Gastroparesis Epidemiology Forecast Report 2026-2035” offers comprehensive information on the prevalence and demographics of gastroparesis. It projects the future incidence and prevalence rates of gastroparesis across various populations. The study covers age and type as major determinants of the gastroparesis-affected population. The report highlights patterns in the prevalence of gastroparesis over time and projects future trends based on multiple variables.

The report provides a comprehensive overview of the disease, as well as historical and projected data on the epidemiology of gastroparesis in the 8 major markets.

Regions Covered

  • The United States
  • Germany
  • France
  • Italy
  • Spain
  • The United Kingdom
  • Japan
  • India

Gastroparesis: Disease Overview

Gastroparesis is a condition in which the stomach empties food into the small intestine more slowly than normal. This leads to symptoms like nausea, vomiting, bloating, and abdominal pain. In this condition, the muscles in the stomach do not function properly, often due to nerve damage. Diabetes is a major risk factor for gastroparesis, especially when blood sugar levels are poorly controlled. It can damage the vagus nerve over time. Certain medications, particularly those that affect stomach motility, can also cause gastroparesis.

Gastroparesis: Treatment Overview

Prokinetic drugs, such as metoclopramide and domperidone, are prescribed to help stimulate the stomach muscles to improve motility. For managing nausea and vomiting, medications like ondansetron or granisetron can help address the symptoms. Proton pump inhibitors or H2 blockers may be recommended if acid reflux is a problem. Proper management of blood sugar levels is advised for diabetic patients, as uncontrolled blood sugar can worsen gastroparesis.

Epidemiology

The gastroparesis epidemiology section offers information on the patient pool from history to the present as well as the projected trend for each of the 8 major markets. Expert Market Research provides both current and predicted trends for gastroparesis by examining a wide range of studies. Additionally, the report covers the diagnosed patient pool for gastroparesis and their trends. The data is broken down into specific categories, such as the total diagnosed cases across different age groups and patient pools.

  • Prevalence data for gastroparesis in the United States varies due to differences in measurement methods. One recent study, using a health insurance database, found a prevalence of 267.7 per 100,000 adults. However, estimates based on regression models suggest that gastroparesis could affect as much as 1.8% of the population.
  • The standardized prevalence of gastroparesis varied widely, ranging from 13.8 to 267.7 per 100,000 adults, based on studies conducted between 1994 and 2019, according to a 2023 systematic review.
  • Studies show that the incidence of gastroparesis is four times higher in women than in men and increases with age in both sexes.
  • As per a 2022 study published in Gastroenterology, the most common cause of gastroparesis was diabetes, accounting for 57.4% of cases (with 5.7% having type 1 and 51.7% having type 2 diabetes). This was followed by postsurgical (15.0%), drug-induced (11.8%), and idiopathic (11.3%) causes.

Gastroparesis Number Of Cases By Country

Read more about this report - Request a Free Sample

Country-wise Gastroparesis Epidemiology

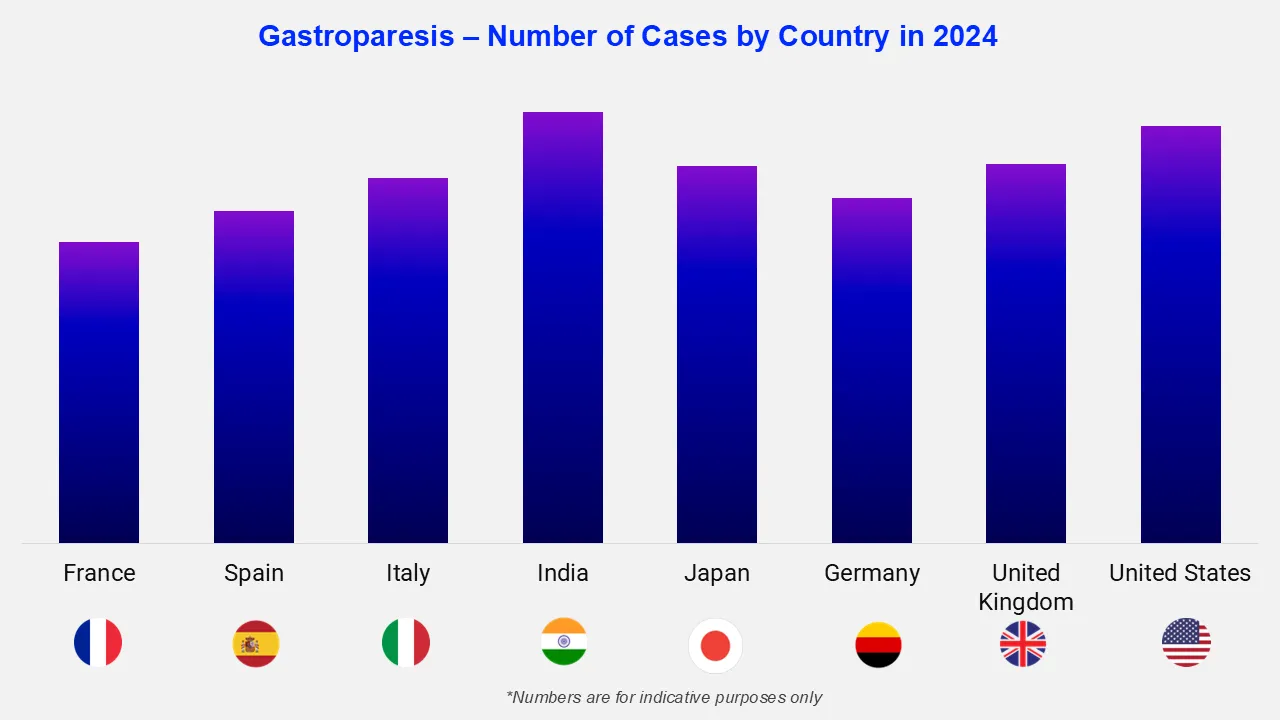
The gastroparesis epidemiology data and findings for the United States, Germany, Spain, Italy, France, the United Kingdom, Japan, and India are also provided in the epidemiology section.

The epidemiology of gastroparesis varies significantly between countries due to differences in the prevalence of underlying conditions such as diabetes, healthcare access, diagnostic practices, dietary habits, and genetic factors. Additionally, the level of public awareness, healthcare infrastructure, and socioeconomic conditions also impact the prevalence rates. In the United Kingdom, the prevalence of diagnosed gastroparesis was reported to be around 13.8 per 100,000 persons.

Country Specific Stats:

Country

Prevalence (Unit)

United States

XX

United Kingdom

XX

Germany

XX

Italy

XX

France

XX

Spain

XX

Japan

XX

India

XX

Scope of the Report

  • The report covers a detailed analysis of signs and symptoms, causes, risk factors, pathophysiology, diagnosis, treatment options, and classification/types of gastroparesis based on several factors.
  • The Gastroparesis Epidemiology Forecast Report covers data for the eight major markets (the US, France, Germany, Italy, Spain, the UK, Japan, and India).
  • The report helps to identify the patient population, and the unmet needs of gastroparesis are highlighted along with an assessment of the disease's risk and burden.

Key Questions Answered

  • What are the key findings of gastroparesis epidemiology in the 8 major markets?
  • What will be the total number of patients with gastroparesis across the 8 major markets during the forecast period?
  • What was the country-wise prevalence of gastroparesis in the 8 major markets in the historical period?
  • Which country will have the highest number of gastroparesis patients during the forecast period of 2026-2035?
  • Which key factors would influence the shift in the patient population of gastroparesis during the forecast period of 2026-2035?
  • What are the currently available treatments for gastroparesis?
  • What are the disease risks, signs, symptoms, and unmet needs of gastroparesis?

Related Reports

Global Diabetic Gastroparesis Treatment Market Report and Forecast

Diabetic Gastroparesis Drug Pipeline Analysis Report

*While we strive to always give you current and accurate information, the numbers depicted on the website are indicative and may differ from the actual numbers in the main report. At Expert Market Research, we aim to bring you the latest insights and trends in the market. Using our analyses and forecasts, stakeholders can understand the market dynamics, navigate challenges, and capitalize on opportunities to make data-driven strategic decisions.*

Looking for specific insights?

Get in touch with us for a customized solution tailored to your unique requirements and save upto 35%!

Report Summary

Explore our key highlights of the report and gain a concise overview of key findings, trends, and actionable insights that will empower your strategic decisions.

Key Highlights of the Report

Please note that the figures mentioned in the description serve as estimates and may vary from the actual figures presented in the final report.

Report Features

Details

Base Year

2025

Historical Period

2019-2025

Forecast Period

2026-2035

Geographies Covered

  • United States
  • Germany
  • Italy
  • France
  • Spain
  • United Kingdom
  • Japan
  • India

Datasheet

10 % Off

USD

1,999

1,799

Single User License

10 % Off

USD

2,999

2,699

Five User License

15 % Off

USD

4,399

3,739

Corporate License

15 % Off

USD

5,799

4,929

Datasheet

One User

USD 1,999

USD 1,799

tax inclusive*

  • Selected Segments
  • Printing Restrictions
  • Excel Spreadsheet Delivered via Email
  • Full Report
  • Periodic Updates
  • Post Sales Analysts Support
  • Unlimited Prints

Single User License

One User

USD 2,999

USD 2,699

tax inclusive*

  • All Segments
  • Printing Restrictions
  • PDF Delivered via Email
  • Custom Report Layout
  • Post Sales Analysts Support
  • Periodic Updates
  • Unlimited Prints

Five User License

Five User

USD 4,399

USD 3,739

tax inclusive*

  • All Segments
  • Five Prints Available
  • PDF Delivered via Email
  • Limited Free Customization
  • Post Sales Analyst Support
  • Custom Report Layout
  • Periodic Updates
  • Unlimited Prints

Corporate License

Unlimited Users

USD 5,799

USD 4,929

tax inclusive*

  • All Segments
  • Unlimited Prints Available
  • PDF & Excel Delivery via Email
  • Limited Free Customization
  • Post Sales Analysts Support
  • Discount On Next Update
  • Custom Report Layout

*Please note that the prices mentioned below are starting prices for each bundle type. Kindly contact our team for further details.*

Bundle Type

Flash Bundle

20% OFF Number of Reports: 3

Small Business Bundle

25% OFF Number of Reports: 5

Growth Bundle

30% OFF Number of Reports: 8

Enterprise Bundle

35% OFF Number of Reports: 10
Overview
  • Life Time Access
  • Analyst Support Related to Report
  • PDF Version of the Report
  • Complimentary Excel Data Set
  • Free Analyst Hours
  • Complimentary Free 1 Month Subscription to Trade Data Base
  • Complimentary One Month Subscription to Price Database (Chemicals only)
  • Complimentary PPT Version of the Report
  • Complimentary License Upgrade
  • Complimentary Power BI Dashboards
  • Life Time Access
  • Analyst Support Related to Report
  • PDF Version of the Report
  • Complimentary Excel Data Set
  • Free Analyst Hours - 50 Hours
  • Complimentary Free 1 Month Subscription to Trade Data Base
  • Complimentary One Month Subscription to Price Database (Chemicals only)
  • Complimentary PPT Version of the Report
  • Complimentary License Upgrade
  • Complimentary Power BI Dashboards
  • Life Time Access
  • Analyst Support Related to Report
  • PDF Version of the Report
  • Complimentary Excel Data Set
  • Free Analyst Hours - 80 Hours
  • Complimentary Free 1 Month Subscription to Trade Data Base
  • Complimentary One Month Subscription to Price Database (Chemicals only)
  • Complimentary PPT Version of the Report
  • Complimentary License Upgrade
  • Complimentary Power BI Dashboards
  • Life Time Access
  • Analyst Support Related to Report
  • PDF Version of the Report
  • Complimentary Excel Data Set
  • Free Analyst Hours - 100 Hours
  • Complimentary Free 1 Month Subscription to Trade Data Base
  • Complimentary One Month Subscription to Price Database (Chemicals only)
  • Complimentary PPT Version of the Report
  • Complimentary License Upgrade
  • Complimentary Power BI Dashboards

*Please note that the prices mentioned below are starting prices for each bundle type. Kindly contact our team for further details.*

Flash Bundle

Number of Reports: 3

20%

tax inclusive*

  • 3 Reports Included
  • Life Time Acess
  • Analyst Support Related to Report
  • PDF Version of the Report
  • Free 1 Month Subscription to Trade Data Base
  • 1 Month Subscription to Price Database (Chemicals only)
  • Complimentary Excel Data Set
  • PPT Version of the Report
  • Power BI Dashboards
  • License Upgrade
  • Free Analyst Hours

Small Business Bundle

Number of Reports: 5

25%

tax inclusive*

  • 5 Reports Included
  • Life Time Acess
  • Analyst Support Related to Report
  • PDF Version of the Report
  • Complimentary Excel Data Set
  • Free Analyst Hours - 50 Hours
  • Free 1 Month Subscription to Trade Data Base
  • 1 Month Subscription to Price Database (Chemicals only)
  • Complimentary Excel Data Set
  • PPT Version of the Report
  • Power BI Dashboards
  • License Upgrade

Growth Bundle

Number of Reports: 8

30%

tax inclusive*

  • 8 Reports Included
  • Life Time Acess
  • Analyst Support Related to Report
  • PDF Version of the Report
  • Complimentary Excel Data Set
  • Free Analyst Hours - 50 Hours
  • Free 1 Month Subscription to Trade Data Base
  • 1 Month Subscription to Price Database (Chemicals only)
  • License Upgrade
  • Free Analyst Hours - 80 Hours
  • Power BI Dashboards

Enterprise Bundle

Number of Reports: 10

35%

tax inclusive*

  • 10 Reports Included
  • Life Time Acess
  • Analyst Support Related to Report
  • PDF Version of the Report
  • Complimentary Excel Data Set
  • Free Analyst Hours - 50 Hours
  • Free 1 Month Subscription to Trade Data Base
  • 1 Month Subscription to Price Database (Chemicals only)
  • License Upgrade
  • Power BI Dashboards
  • Free Analyst Hours - 100 Hours

How To Order

This is a collaborative report by Vishakha Agrawal reflecting perspectives and research-driven insights from Expert Market Research.

Our step-by-step guide will help you select, purchase, and access your reports swiftly, ensuring you get the information that drives your decisions, right when you need it.

License Type

Select License Type

Choose the right license for your needs and access rights.

shopping cart

Click on ‘Buy Now’

Add the report to your cart with one click and proceed to register.

Select Mode of Payment

Choose a payment option for a secure checkout. You will be redirected accordingly.

Strategic Solutions for Informed Decision-Making

Connect For More Information

Our expert team of analysts will offer full support and resolve any queries regarding the report, before and after the purchase.

Our expert team of analysts will offer full support and resolve any queries regarding the report, before and after the purchase.

We employ meticulous research methods, blending advanced analytics and expert insights to deliver accurate, actionable industry intelligence, staying ahead of competitors.

Our skilled analysts offer unparalleled competitive advantage with detailed insights on current and emerging markets, ensuring your strategic edge.

We offer an in-depth yet simplified presentation of industry insights and analysis to meet your specific requirements effectively.

We’re here to help answer any questions about our products and services.

Contact us