Add 2 More Reports For 20% off

Report Overview

The overall birth prevalence of pre/perinatal cerebral palsy is 1.6 per 1000 live births in high‐income countries whereas in in low- and middle-income countries, the birth prevalence can reach as high as 3.4 per 1000 live births. Several factors such as premature birth, low birth weight, and birth complications, among others, can disrupt normal brain development, leading to cerebral palsy.

2024

Base Year

2018-2024

Historical Year

2025-2034

Forecast Year

Cerebral Palsy Epidemiology Forecast Report Coverage

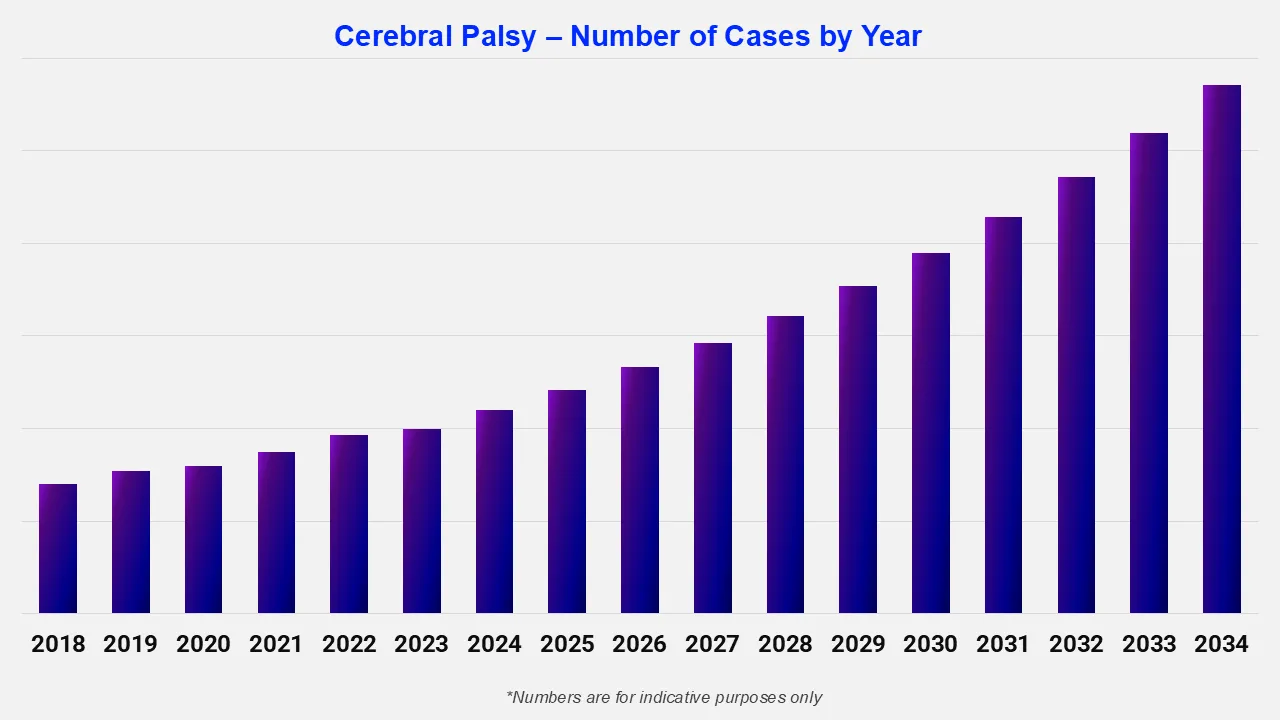
Expert Market Research's “Cerebral Palsy Epidemiology Forecast Report 2034’’ offers comprehensive information on the prevalence and demographics of cerebral palsy. It projects the future incidence and prevalence rates of cerebral palsy across various populations. The study covers age, gender, and type as major determinants of the cerebral palsy-affected population. The report highlights patterns in the prevalence of cerebral palsy over time and projects future trends based on multiple variables.

The report provides a comprehensive overview of the disease, as well as historical and projected data on the epidemiology of cerebral palsy in the 8 major markets.

Regions Covered

  • The United States
  • EU-4 (Germany, France, Italy, Spain) and the United Kingdom
  • Japan
  • India

Cerebral Palsy: Disease Overview

Cerebral palsy comprises a group of neurological disorders that occur in infancy or early childhood. This congenital disorder is caused by abnormal brain development, often before birth, and affects movement, posture, or muscle tone. Cerebral palsy ranks as the most common motor disability in children, with the symptoms varying from person to person. Spastic, dyskinetic, ataxic, hypotonic, and mixed are the four main types of cerebral palsy, with spastic cerebral palsy occurring in 80% of the cases.

Cerebral Palsy: Treatment Overview

Although there is no cure for cerebral palsy, a combination of therapies, medications, surgeries, and assistive devices can help the affected individuals live with greater independence and manage their physical and neurological symptoms. Physical therapy including muscle-strengthening exercises, balance training, and stretching is widely used for improving muscle strength in patients. Further, antispasmodic drugs and pain relief medications are also prescribed to address various symptoms.

Epidemiology

The cerebral palsy epidemiology section offers information on the patient pool from history to the present as well as the projected trend for each of the 8 major markets. Expert Market Research provides both current and predicted trends for cerebral palsy by examining a wide range of studies. Additionally, the report covers the diagnosed patient pool for cerebral palsy and its trends. The data is broken down into specific categories, such as total prevalent cases in males and females, and total diagnosed cases across different age groups and patient pools.

  • According to the systematic analysis published by McIntyre, Sarah et al. (2022), the overall birth prevalence of pre/perinatal cerebral palsy is 1.6 per 1000 live births in high income countries. In low- and middle-income countries, the birth prevalence of cerebral palsy is higher compared to high-income countries and is estimated to reach as high as 3.4 per 1000 live births.
  • A BMJ (2017) article reports that roughly 15-20% of physically disabled children are impacted by cerebral palsy. Further, the Global report on children with developmental disabilities by the World Health Organization and UNICEF (2023) states that over one-third of children living with intellectual disability suffer from one or more co-occurring conditions including cerebral palsy.
  • Various studies have indicated that cerebral palsy affects 2.3 to 3.6 per 1000 children in the United States.
  • Cerebral palsy is reported to affect nearly twice as many men as women, according to Park, M.S. (2024). This difference in prevalence can be a result of the higher rate of low birth weight and preterm births in males as compared to females.

Country-wise Cerebral Palsy Epidemiology

The Cerebral Palsy epidemiology data and findings for the United States, EU-4 (Germany, Spain, Italy, France), the United Kingdom, Japan, and India are also provided in the epidemiology section. rates of premature births, quality of maternal and neonatal care, and access to healthcare services.

The epidemiology of cerebral palsy varies between countries owing to factors such as rates of premature births, quality of maternal and neonatal care, and access to healthcare services. It is reported that countries with high-quality medical technologies have lower rates of cerebral palsy since timely interventions can prevent complications that lead to brain injury. In India, around 3.8% of the population is estimated to have some form of disability and the incidence of cerebral palsy is about 3/1000 live births.

Country Specific Stats:

Country

Prevalence (Unit)

United States

XX

United Kingdom

~1 in every 400 children

Germany

XX

Italy

XX

France

XX

Spain

XX

Japan

XX

India

~2.95/1000 children

Scope of the Report

  • The report covers a detailed analysis of signs and symptoms, causes, risk factors, pathophysiology, diagnosis, treatment options, and classification/types of cerebral palsy based on several factors.
  • Cerebral Palsy Epidemiology Forecast Report covers data for the eight major markets (the US, France, Germany, Italy, Spain, the UK, Japan, and India).
  • The report helps to identify the patient population and the unmet needs of cerebral palsy are highlighted along with an assessment of the disease's risk and burden.

Key Questions Answered

  • What are the key findings of cerebral palsy epidemiology in 8MM?
  • What will be the total number of patients with cerebral palsy across the 8MM during the forecast period 2025-2034?
  • What was the country-wise prevalence of cerebral palsy in the 8 major markets in the historical period?
  • Which country will have the highest number of cerebral palsy patients during the forecast period of 2025-2034?
  • Which key factors would influence the shift in the patient population of cerebral palsy during the forecast period of 2025-2034?
  • What are the currently available treatments for cerebral palsy?
  • What are the disease risks, signs, symptoms, and unmet needs of cerebral palsy?

Related Reports

Neurological Disease Treatment Market

*While we strive to always give you current and accurate information, the numbers depicted on the website are indicative and may differ from the actual numbers in the main report. At Expert Market Research, we aim to bring you the latest insights and trends in the market. Using our analyses and forecasts, stakeholders can understand the market dynamics, navigate challenges, and capitalize on opportunities to make data-driven strategic decisions.*

Looking for specific insights?

Get in touch with us for a customized solution tailored to your unique requirements and save upto 35%!

Report Summary

Explore our key highlights of the report and gain a concise overview of key findings, trends, and actionable insights that will empower your strategic decisions.

Key Highlights of the Report

Please note that the figures mentioned in the description serve as estimates and may vary from the actual figures presented in the final report.

Report Features

Details

Base Year

2024

Historical Period

2018-2024

Forecast Period

2025-2034

Epidemiology Statistics Provided

  • Diagnosed Prevalent Cases
  • Type-Specific Cases
  • Gender-Specific Cases
  • Age-Specific Cases

Segmentation Provided

  • Epidemiology by Age Group
  • Epidemiology by Gender
  • Epidemiology by Type of Disease
  • Epidemiology by Region

Geographies Covered

  • United States
  • United Kingdom
  • Germany
  • Italy
  • France
  • Spain
  • Japan
  • India

Datasheet

10% OFF

USD

2,199

1,869

Single User License

10% OFF

USD

3,299

2,799

Five User License

10% OFF

USD

4,399

3,699

Corporate License

10% OFF

USD

5,499

4,699

Datasheet


USD 2,199

USD 1,869

tax inclusive*

  • Selected Sections, One User
  • Printing Not Allowed
  • Email Delivery in PDF
  • Free Limited Customisation
  • Post Sales Analyst Support
  • 50% Discount on Next Update

Single User License

One User

USD 3,299

USD 2,799

tax inclusive*

  • All Sections, One User
  • One Print Allowed
  • Email Delivery in PDF
  • Free Limited Customisation
  • Post Sales Analyst Support
  • 50% Discount on Next Update

Five User License

Five Users

USD 4,399

USD 3,699

tax inclusive*

  • All Sections, Five Users
  • Five Prints Allowed
  • Email Delivery in PDF
  • Free Limited Customisation
  • Post Sales Analyst Support
  • 50% Discount on Next Update

Corporate License

Unlimited Users

USD 5,499

USD 4,699

tax inclusive*

  • All Sections, Unlimited Users
  • Unlimited Prints Allowed
  • Email Delivery in PDF + Excel
  • Free Limited Customisation
  • Post Sales Analyst Support
  • 50% Discount on Next Update

*Please note that the prices mentioned below are starting prices for each bundle type. Kindly contact our team for further details.*

Bundle Type

Flash Bundle

20% OFF Number of Reports: 3

Small Business Bundle

25% OFF Number of Reports: 5

Growth Bundle

30% OFF Number of Reports: 8

Enterprise Bundle

35% OFF Number of Reports: 10
Overview
  • Life Time Access
  • Analyst Support Related to Report
  • PDF Version of the Report
  • Complimentary Excel Data Set
  • Free Analyst Hours
  • Complimentary Free 1 Month Subscription to Trade Data Base
  • Complimentary One Month Subscription to Price Database (Chemicals only)
  • Complementary PPT Version of the Report
  • Complimentary License Upgrade
  • Complimentary Power BI Dashboards
  • Life Time Access
  • Analyst Support Related to Report
  • PDF Version of the Report
  • Complimentary Excel Data Set
  • Free Analyst Hours - 50 Hours
  • Complimentary Free 1 Month Subscription to Trade Data Base
  • Complimentary One Month Subscription to Price Database (Chemicals only)
  • Complementary PPT Version of the Report
  • Complimentary License Upgrade
  • Complimentary Power BI Dashboards
  • Life Time Access
  • Analyst Support Related to Report
  • PDF Version of the Report
  • Complimentary Excel Data Set
  • Free Analyst Hours - 80 Hours
  • Complimentary Free 1 Month Subscription to Trade Data Base
  • Complimentary One Month Subscription to Price Database (Chemicals only)
  • Complementary PPT Version of the Report
  • Complimentary License Upgrade
  • Complimentary Power BI Dashboards
  • Life Time Access
  • Analyst Support Related to Report
  • PDF Version of the Report
  • Complimentary Excel Data Set
  • Free Analyst Hours - 100 Hours
  • Complimentary Free 1 Month Subscription to Trade Data Base
  • Complimentary One Month Subscription to Price Database (Chemicals only)
  • Complementary PPT Version of the Report
  • Complimentary License Upgrade
  • Complimentary Power BI Dashboards

*Please note that the prices mentioned below are starting prices for each bundle type. Kindly contact our team for further details.*

Flash Bundle

Number of Reports: 3

20%

tax inclusive*

  • 3 Reports Included
  • Life Time Acess
  • Analyst Support Related to Report
  • PDF Version of the Report
  • Free 1 Month Subscription to Trade Data Base
  • 1 Month Subscription to Price Database (Chemicals only)
  • Complimentary Excel Data Set
  • PPT Version of the Report
  • Power BI Dashboards
  • License Upgrade
  • Free Analyst Hours

Small Business Bundle

Number of Reports: 5

25%

tax inclusive*

  • 5 Reports Included
  • Life Time Acess
  • Analyst Support Related to Report
  • PDF Version of the Report
  • Complimentary Excel Data Set
  • Free Analyst Hours - 50 Hours
  • Free 1 Month Subscription to Trade Data Base
  • 1 Month Subscription to Price Database (Chemicals only)
  • Complimentary Excel Data Set
  • PPT Version of the Report
  • Power BI Dashboards
  • License Upgrade

Growth Bundle

Number of Reports: 8

30%

tax inclusive*

  • 8 Reports Included
  • Life Time Acess
  • Analyst Support Related to Report
  • PDF Version of the Report
  • Complimentary Excel Data Set
  • Free Analyst Hours - 50 Hours
  • Free 1 Month Subscription to Trade Data Base
  • 1 Month Subscription to Price Database (Chemicals only)
  • License Upgrade
  • Free Analyst Hours - 80 Hours
  • Power BI Dashboards

Enterprise Bundle

Number of Reports: 10

35%

tax inclusive*

  • 10 Reports Included
  • Life Time Acess
  • Analyst Support Related to Report
  • PDF Version of the Report
  • Complimentary Excel Data Set
  • Free Analyst Hours - 50 Hours
  • Free 1 Month Subscription to Trade Data Base
  • 1 Month Subscription to Price Database (Chemicals only)
  • License Upgrade
  • Power BI Dashboards
  • Free Analyst Hours - 100 Hours

How To Order

Our step-by-step guide will help you select, purchase, and access your reports swiftly, ensuring you get the information that drives your decisions, right when you need it.

Select License Type

Choose the right license for your needs and access rights.

Click on ‘Buy Now’

Add the report to your cart with one click and proceed to register.

Select Mode of Payment

Choose a payment option for a secure checkout. You will be redirected accordingly.

Strategic Solutions for Informed Decision-Making

Connect For More Information

Our expert team of analysts will offer full support and resolve any queries regarding the report, before and after the purchase.

Our expert team of analysts will offer full support and resolve any queries regarding the report, before and after the purchase.

We employ meticulous research methods, blending advanced analytics and expert insights to deliver accurate, actionable industry intelligence, staying ahead of competitors.

Our skilled analysts offer unparalleled competitive advantage with detailed insights on current and emerging markets, ensuring your strategic edge.

We offer an in-depth yet simplified presentation of industry insights and analysis to meet your specific requirements effectively.

We’re here to help answer any questions about our products and services.

Contact us

Our Offices


Australia

63 Fiona Drive, Tamworth, NSW

+61-448-061-727

India

C130 Sector 2 Noida, Uttar Pradesh 201301

+91-858-608-1494

Philippines

40th Floor, PBCom Tower, 6795 Ayala Avenue Cor V.A Rufino St. Makati City,1226.

+63-287-899-028, +63-967-048-3306

United Kingdom

6 Gardner Place, Becketts Close, Feltham TW14 0BX, Greater London

+44-753-713-2163

United States

30 North Gould Street, Sheridan, WY 82801

+1-415-325-5166

Vietnam

193/26/4 St.no.6, Ward Binh Hung Hoa, Binh Tan District, Ho Chi Minh City

+84-865-399-124

30 North Gould Street, Sheridan, WY 82801

+1-415-325-5166

63 Fiona Drive, Tamworth, NSW

+61-448-061-727

C130 Sector 2 Noida, Uttar Pradesh 201301

+91-858-608-1494

40th Floor, PBCom Tower, 6795 Ayala Avenue Cor V.A Rufino St. Makati City, 1226.

+63-287-899-028, +63-967-048-3306

6 Gardner Place, Becketts Close, Feltham TW14 0BX, Greater London

+44-753-713-2163

193/26/4 St.no.6, Ward Binh Hung Hoa, Binh Tan District, Ho Chi Minh City

+84-865-399-124