Consumer Insights
Uncover trends and behaviors shaping consumer choices today
Procurement Insights
Optimize your sourcing strategy with key market data
Industry Stats
Stay ahead with the latest trends and market analysis.
The median worldwide prevalence of allergic rhinitis is estimated to be 18.1%, with most of the studies reporting a rise in rhinitis prevalence over the last decades. Pollen and mites (67.31%), animal dander and pollutants (23.08%), and fungal allergens (21.15%) are considered the most common aero-allergens for allergic rhinitis.
Base Year
Historical Period
Forecast Period

Read more about this report - Request a Free Sample
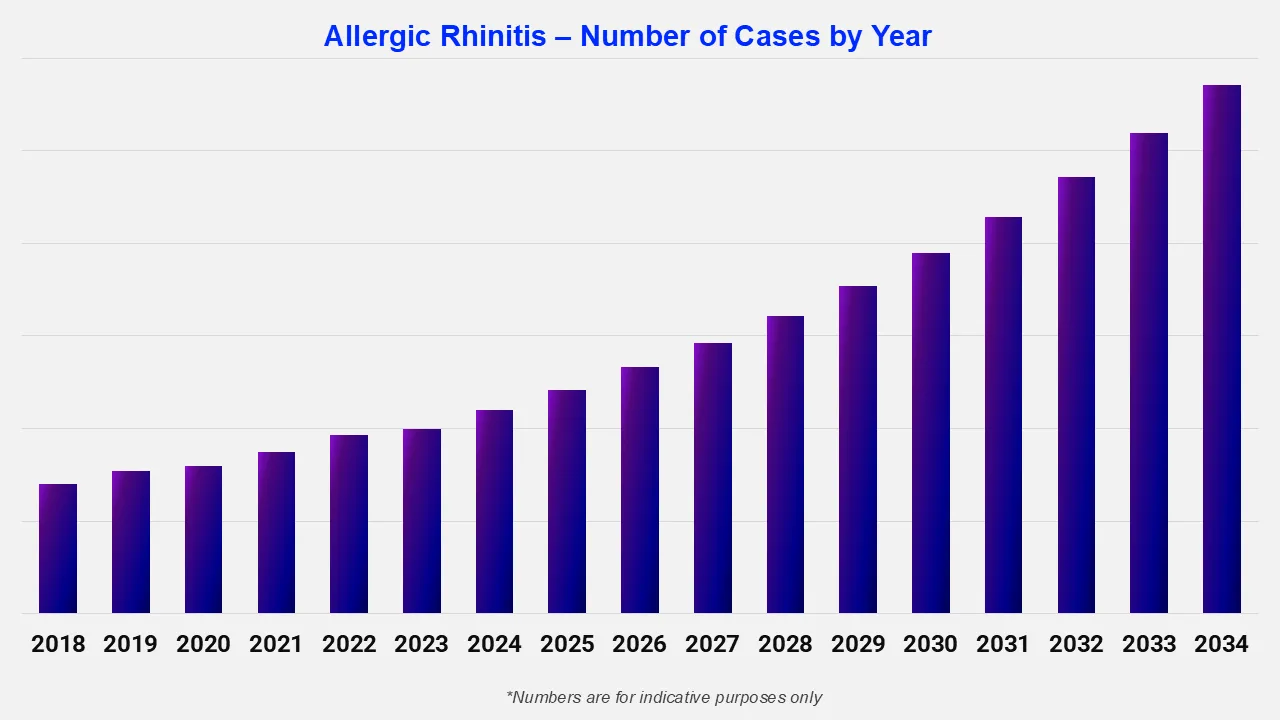
Expert Market Research's “Allergic Rhinitis Epidemiology Forecast Report 2026-2035” offers comprehensive information on the prevalence and demographics of allergic rhinitis. It projects the future incidence and prevalence rates of allergic rhinitis across various populations. The study covers age, gender, and type as major determinants of the allergic rhinitis-affected population. The report highlights patterns in the prevalence of allergic rhinitis over time and projects future trends based on multiple variables.
The report provides a comprehensive overview of the disease, as well as historical and projected data on the epidemiology of allergic rhinitis in the 8 major markets.
Regions Covered
Allergic rhinitis, also known as hay fever, is a clinical condition linked with a group of symptoms that affect the nose. It occurs when the immune system shows an abnormal reaction to an allergen like pollen, dust, or mold. Hay fever can cause sneezing, runny nose, itchy nose, decreased sense of smell, and sore throat, among others. Allergic rhinitis can be classified into two types: seasonal (occurs at certain times of the year) and perennial (occurs all year).
Nasal corticosteroid sprays are considered the most effective treatment for allergic rhinitis. It can be used regularly and is safe for both adults and children. Antihistamines, in the form of tablets, syrups, intranasal sprays, and eye drops, are often used to manage the symptoms (sneezing, itchy eyes, and watery eyes) associated with allergic rhinitis. Decongestants are also prescribed to treat stuffy or runny nose.
The allergic rhinitis epidemiology section offers information on the patient pool from history to the present as well as the projected trend for each of the 8 major markets. Expert Market Research provides both current and predicted trends for allergic rhinitis by examining a wide range of studies. Additionally, the report covers the diagnosed patient pool for allergic rhinitis and their trends. The data is broken down into specific categories, such as total prevalent cases in males and females, and total diagnosed cases across different age groups and patient pools.

Read more about this report - Request a Free Sample
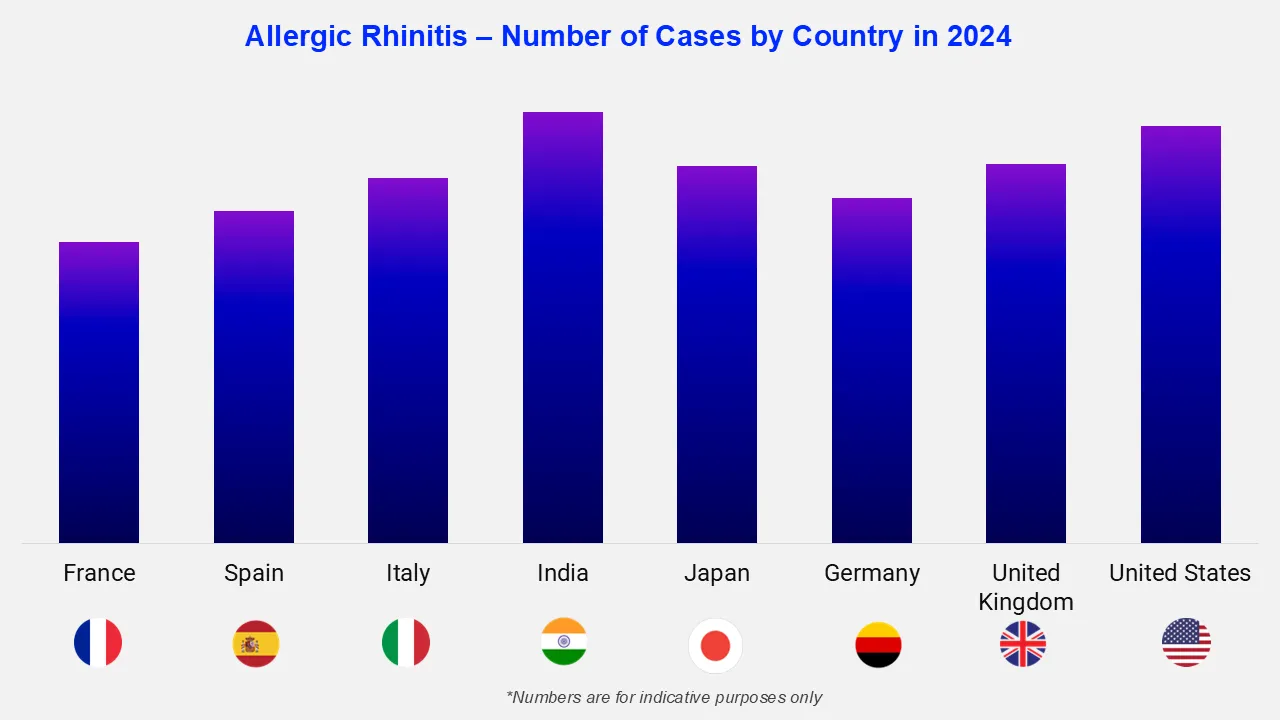
The allergic rhinitis epidemiology data and findings for the United States, EU-4 (Germany, Spain, Italy, France), the United Kingdom, Japan, and India are also provided in the epidemiology section.
The epidemiology of allergic rhinitis differs between countries due to several factors including local environmental conditions, genetic predispositions, exposure to air pollution, and access to healthcare, among others. According to the CDC’s National Center for Health Statistics, approximately 1 out of 3 adults and over 1 in 4 children reported to be affected by a seasonal allergy, food allergy, or eczema in the United States in 2021. Further, the National Health Interview Survey reported that 18.9% of children were affected by allergic rhinitis or hay fever in 2021.
Country Specific Stats:
|
Country |
Prevalence (Unit) |
|
United States |
XX |
|
United Kingdom |
XX |
|
Germany |
XX |
|
Italy |
XX |
|
France |
XX |
|
Spain |
XX |
|
Japan |
XX |
|
India |
XX |


*While we strive to always give you current and accurate information, the numbers depicted on the website are indicative and may differ from the actual numbers in the main report. At Expert Market Research, we aim to bring you the latest insights and trends in the market. Using our analyses and forecasts, stakeholders can understand the market dynamics, navigate challenges, and capitalize on opportunities to make data-driven strategic decisions.*
Get in touch with us for a customized solution tailored to your unique requirements and save upto 35%!
Explore our key highlights of the report and gain a concise overview of key findings, trends, and actionable insights that will empower your strategic decisions.
|
Report Features |
Details |
|
Base Year |
2025 |
|
Historical Period |
2019-2025 |
|
Forecast Period |
2026-2035 |
|
Epidemiology Statistics Provided |
|
|
Segmentation Provided |
|
|
Geographies Covered |
|
Datasheet
One User
USD 1,999
USD 1,799
tax inclusive*
Single User License
One User
USD 2,999
USD 2,699
tax inclusive*
Five User License
Five User
USD 4,399
USD 3,739
tax inclusive*
Corporate License
Unlimited Users
USD 5,799
USD 4,929
tax inclusive*
*Please note that the prices mentioned below are starting prices for each bundle type. Kindly contact our team for further details.*
Flash Bundle
Small Business Bundle
Growth Bundle
Enterprise Bundle
*Please note that the prices mentioned below are starting prices for each bundle type. Kindly contact our team for further details.*
Flash Bundle
Number of Reports: 3
20%
tax inclusive*
Small Business Bundle
Number of Reports: 5
25%
tax inclusive*
Growth Bundle
Number of Reports: 8
30%
tax inclusive*
Enterprise Bundle
Number of Reports: 10
35%
tax inclusive*
How To Order

Select License Type
Choose the right license for your needs and access rights.

Click on ‘Buy Now’
Add the report to your cart with one click and proceed to register.

Select Mode of Payment
Choose a payment option for a secure checkout. You will be redirected accordingly.
Gain insights to stay ahead and seize opportunities.

Get insights & trends for a competitive edge.

Track prices with detailed trend reports.

Analyse trade data for supply chain insights.

Leverage cost reports for smart savings

Enhance supply chain with partnerships.

Connect For More Information
Our expert team of analysts will offer full support and resolve any queries regarding the report, before and after the purchase.
Our expert team of analysts will offer full support and resolve any queries regarding the report, before and after the purchase.
We employ meticulous research methods, blending advanced analytics and expert insights to deliver accurate, actionable industry intelligence, staying ahead of competitors.
Our skilled analysts offer unparalleled competitive advantage with detailed insights on current and emerging markets, ensuring your strategic edge.
We offer an in-depth yet simplified presentation of industry insights and analysis to meet your specific requirements effectively.
Share